Tracy profiler#
omni.kit.profiler.tracy#
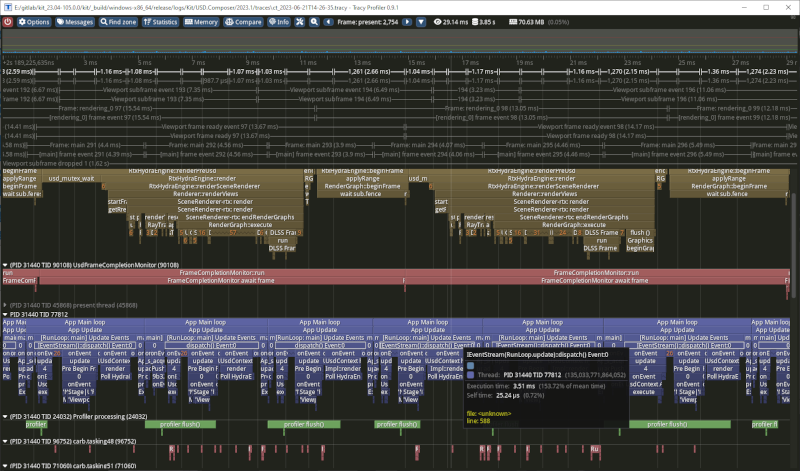
This extension just packages up a recent version of the open source Tracy Profiler UI and a small set of command-line tools that ship with it - and hooks them up to Kit (you can find these files from the Extension manager if you go to omni.kit.profiler.tracy and click on the folder icon - inside the “bin” folder you will find the Tracy app and the aforementioned command-line utilities )
As mentioned in the Kit Developer Documentation and the docs on the <omni.kit.window.profiler extension, Kit (and many of it’s dependencies) uses a library called carb::profiler to allow code to be instrumented in various ways. This instrumentation can be emitted using a number of different backends - and Tracy is one of them. It is used (for the moment, exclusively) in a live/interactive fashion where Kit streams the carb::profiler data to a running Tracy App, rather than e.g saving it to a file
Tracy works with the carb::profiler library used in Kit to
More information is available about Tracy at:
From the Profiler->Tracy menu at the top of the Kit menubar there are 2 options:
Profiler->Tracy->Launch
will launch the Tracy UI (the “Server” in Tracy parlance, the Kit app being the “Client”)
Profiler->Tracy->Launch and Connect will launch an instance of the Tracy UI and stream the output from the carb::profiling tracy backend to the application via a socket. Press “stop” in the Tracy App to stop capturing. Regardless of whether you do this, you will see the data start to appear in the UI after a couple of seconds. You can also stream to a Tracy Application not running on your local machine (useful for remote profiling).
Note that there is currently a limitation where you can only connect to a Tracy “Server” once from Kit, you have to close your Kit app down and reopen it to connect again.
The Tracy format can capture more information than the carb::profiler CPU profiler chrome trace format discussed in the documentation about omni.kit.profiler.window (although there are some things like “flow events” in chrome trace which it doesn’t capture)
It can also capture frame information, the CPU core occupancy, thread dependency, GPU Context information and various other metrics - some requiring specific options - see below

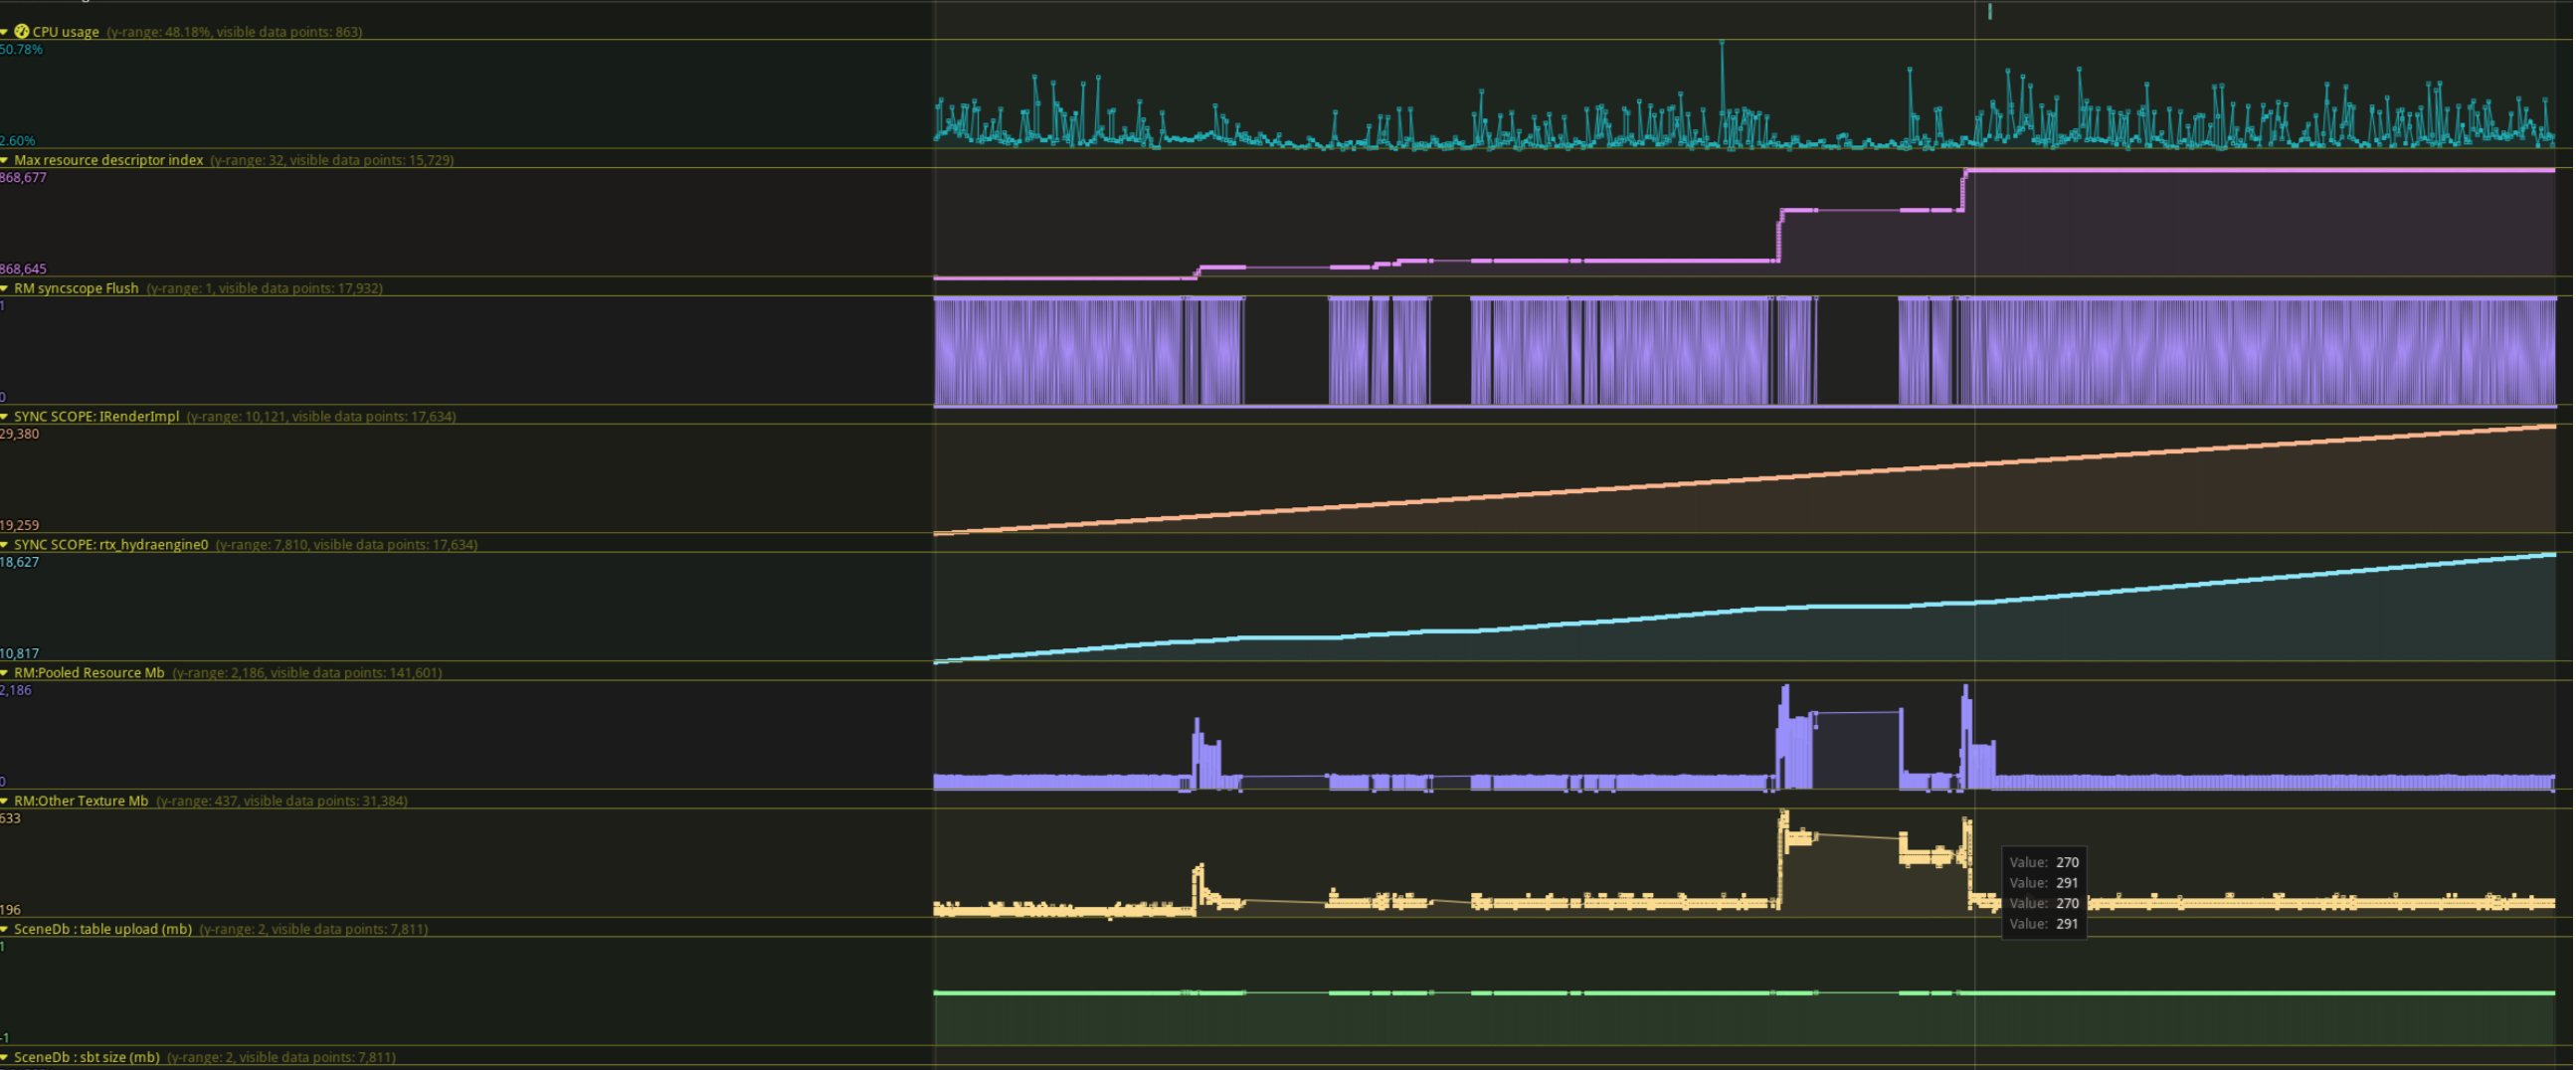
General Metrics#
Any part of the code that is instrumented with a CARB_PROFILE_VALUE macro will emit metrics that can be seen in Tracy

GPU Context ——————-Tracy is also discussed in the page on profiling in the Kit Developer Documentation
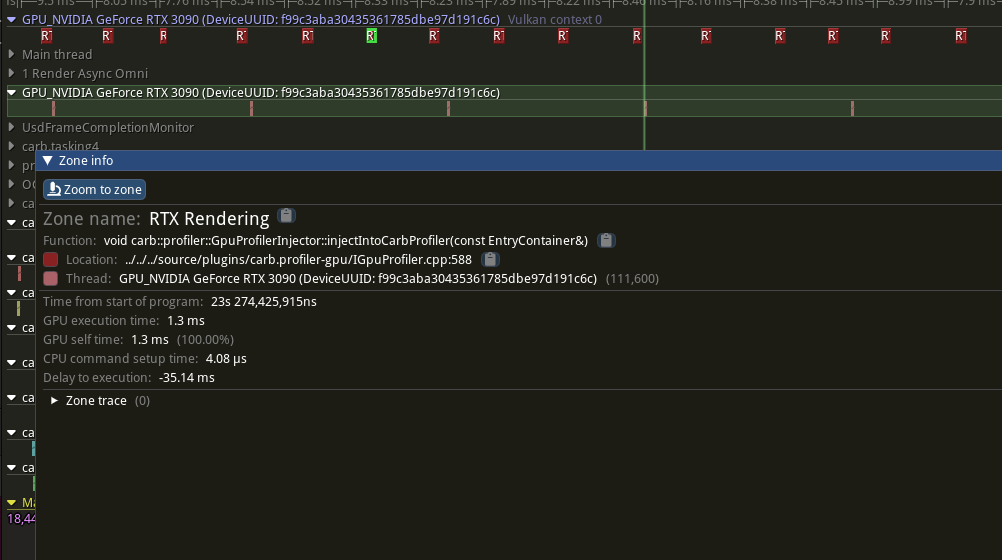
If we start our Kit app like this
my_kit_app.bat --/app/profilerBackend='tracy' --/app/profileFromStart=true --/profiler/gpu/tracyInject/enabled=true
and then launch tracy - we will see some GPU timing information e.g

CPU Core Occupancy#
If we start our Kit app like this (on Linux)
sudo ./my_kit_app.sh --allow-root
(the equivalent on Windows is to open the app with administrator permissions)
and then open Tracy, we will see CPU occupancy

We can combine these 2 sets of arguments to get both CPU occupancy and GPU data
Tasks and Threads#
The carb::tasking system that Kit uses to manage it’s workload (see carb::tasking is based on fibers rather than threads. Bare this in mind when looking at Tracy output, as Tracy currently only shows what the task threads are doing - ideally we would see each fiber as it’s own thread.
Note that Kit and some of it’s dependencies create large numbers of threads upfront for use by the various task schedulers in the Kit stack. This results in an often very sparse looking output in Tracy - you will often manually have to hide the threads which are not doing anything of interest (or have had no work assigned to them at all)
As Kit and it’s dependencies has multiple task schedulers running in their own threads, it can be difficult to see where a task originates from. If you use the debugTaskBacktrace setting specified here tasking settings it can help.