Profiler Window#
omni.kit.window.profiler#
Introduction#
This extension brings together in a single window a range of profiling-related functionality available in Kit and it’s subsystems
Once the extension is enabled, the window can be opened by clicking on Window->Profiler in the main menu bar, or by pressing F8.
It provides access to a number of different profiling systems, including:
carb::profiler (for native CPU code)
GPU Profiler
PerfSDK GPU Profiler
Python cProfile Profiler
Python carb::profiler (omni.kit.profile_python - adds python support to carb::profiler)
Pixar Trace Profiler for USD/Hydra
The APIs and command line aspects of these are discussed in Kit Developer Documentation but here is a brief overview:
carb::profiler#
This is the “core” Kit Profiler - It outputs timings for code spans or zones (based off instrumented functions in the Kit source code and it’s dependencies) in a few different modes/formats:
CPU - writes to chrome trace json format
Tracy - interactive usage - works with Tracy standalone application
NVTX - converts our carb profiler zone annotations into NSight-specific zone annotations, can be read by the NSight Profiler
This UI only supports CPU Mode - Tracy mode does not appear in this UI and is accessed via the omni.kit.profiler.tracy extension. The NVTX mode is not currently from this UI (see developer docs for more details on accessing)
Python Profiler (cProfile)#
This is a standard Python cProfile profile. It will record a .prof file containing a python cProfile trace This can be viewed in a cProfile viewer such as snakeviz. Note that it can have a significant performance impact.
Files are output in a pattern like:
cProfile_${TIMESTAMP}.prof
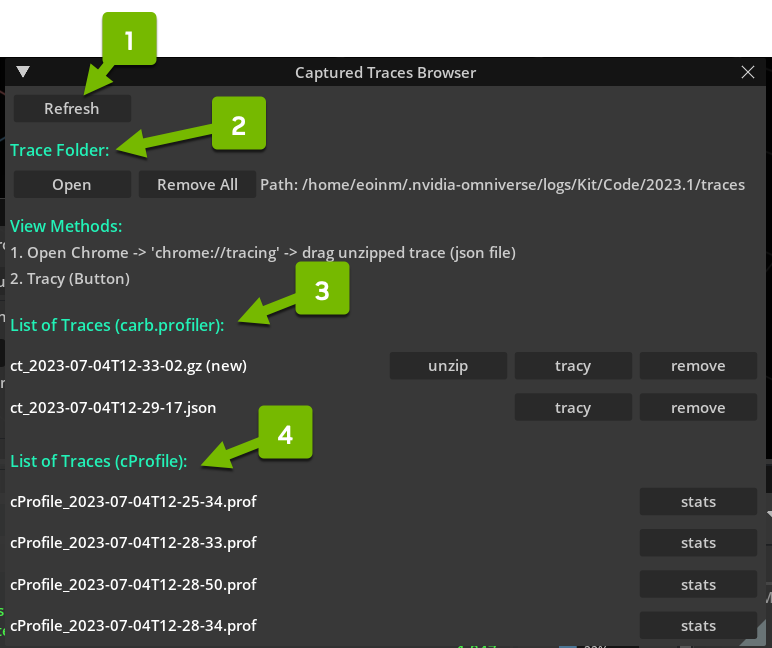
The “stats” output summary that we see (see Captured Traces Browser for how to generate) looks something like this
Tue Jul  4 12:25:38 2023    /home/USERNAME/.nvidia-omniverse/logs/Kit/Code/2023.1/traces/cProfile_2023-07-04T12-25-34.prof

102855 function calls in 0.843 seconds

Ordered by: internal time

ncalls  tottime  percall  cumtime  percall filename:lineno(function)
   485    0.229    0.000    0.229    0.000 {built-in method omni.hydra.engine.stats._stats.get_mem_stats}
   429    0.055    0.000    0.398    0.001 texture.py:324(on_drawable_changed)
   429    0.053    0.000    0.053    0.000 api.py:369(_conform_projection)
  1419    0.040    0.000    0.049    0.000 __init__.py:79(_get_stage)
   429    0.031    0.000    0.031    0.000 display_delegate.py:72(size)
   429    0.022    0.000    0.342    0.001 widget.py:425(__set_image_data)
   485    0.017    0.000    0.319    0.001 profiler.py:940(_on_update)
   485    0.016    0.000    0.032    0.000 profiler.py:761(_update_gpu_nodes)
   429    0.016    0.000    0.091    0.000 api.py:403(_sync_viewport_api)
   485    0.016    0.000    0.048    0.000 profiler.py:742(_update_multi_gpu_nodes)
   429    0.015    0.000    0.030    0.000 __init__.py:1122(__make_update_info)
  1287    0.014    0.000    0.084    0.000 __init__.py:935(_update_stats)
   485    0.014    0.000    0.248    0.001 profiler.py:877(_update_memory_stats)
   429    0.014    0.000    0.014    0.000 __init__.py:66(_get_background_alpha)
  6790    0.012    0.000    0.012    0.000 {method 'format' of 'str' objects}
  1287    0.012    0.000    0.012    0.000 __init__.py:172(visible)
   429    0.011    0.000    0.042    0.000 display_delegate.py:68(update)
omni.kit.profile_python#
This is a separate extension - it’s functionality will only be available if it is loaded.
This uses python’s sys.setprofile functionality to automatically emit carb::profiler zones on each function call. It is only available once the CPU Profiler is active, and writes to the same chrome trace file. Note that it can have a significant performance impact.
- Example output
- python-carb_trace_output.json#
  [
      {
          "name": "Py::log_verbose",
          "cat": "profiler",
          "tid": 61863,
          "ph": "X",
          "pid": 61863,
          "ts": 4.5692132026266927E8,
          "dur": 1.6436537914518922E1,
          "args": {
              "file": "<unknown>",
              "line": 58
          }
      },
      {
          "name": "Py::register",
          "cat": "profiler",
          "tid": 61863,
          "ph": "X",
          "pid": 61863,
          "ts": 4.5692130406103396E8,
          "dur": 3.9284285757339674E1,
          "args": {
              "file": "<unknown>",
              "line": 103
          }
      }
  ]
GPU Profiler#
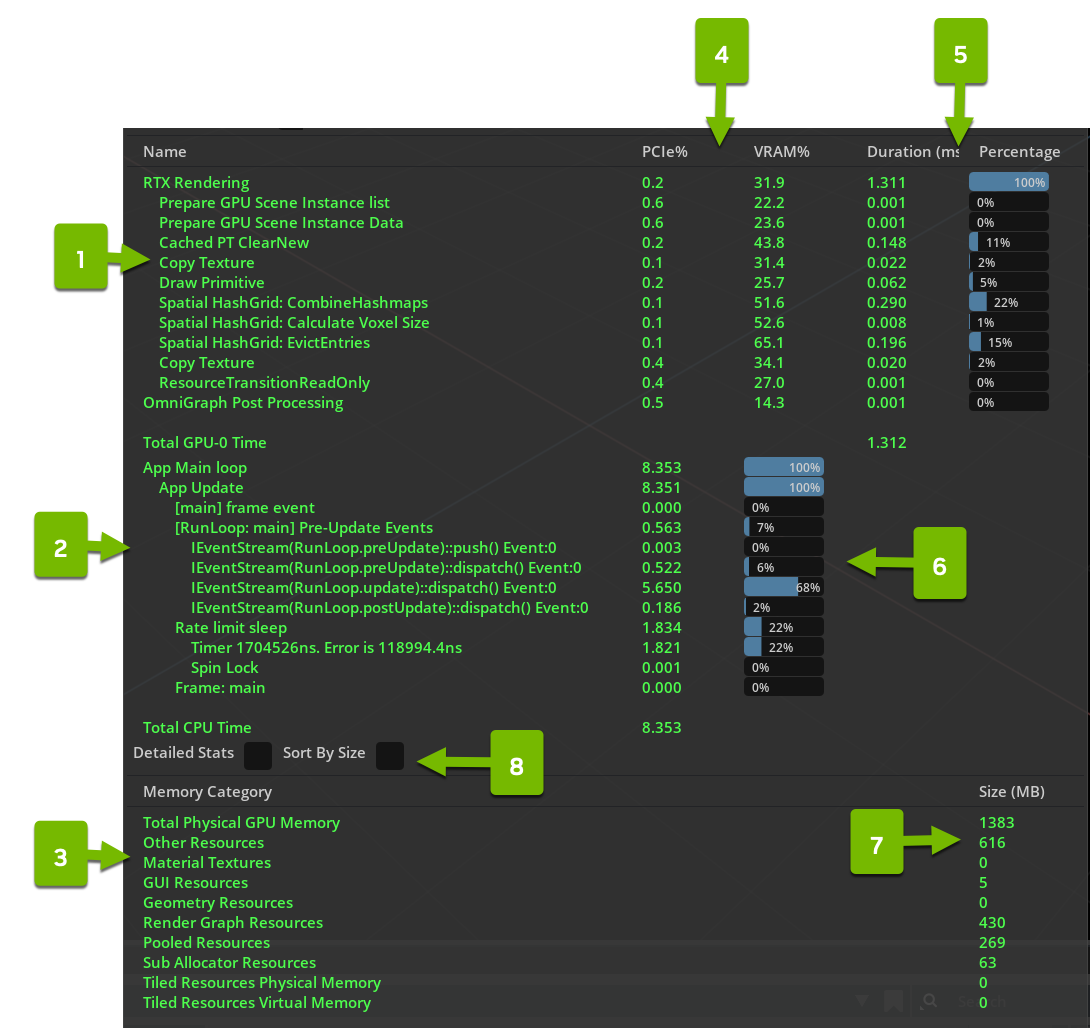
This gives some basic profiling output in the Live Output Section of the Windows.
There are a couple of caveats related to both GPU profilers:
GPU profilers are a different subsystem to the carb.profiler, their output does not go to the “captured traces” folder.
We may have multiple GPUs on a machine running the Kit App we are profiling, but the system profiles only 1 GPU at a time.
perfSDK GPU Profiler#
This emits additional profiling data using NVIDIA GPU Performance Counters, see perfSDK for more info.
It may require elevated privileges - see permission-issue-performance-counters for more information
Pixar Trace Profiler#
This is a profiler written by Pixar as part of the USD project. It’s similar in scope to the carb::profiler in that it’s main job is to emit timing information about instrumented functions in the code (in this case the USD and Hydra parts of the Kit software stack).
See Pixar USD Docs for more info
It’s completely separate from the other profilers in this extension.
It writes to a separate file (pxr-trace.json in the chrome trace format) stored in the current working dir. The file will be written (and the output displayed in the console) when the profiler is toggled off.
Format looks like this
pxr-trace.json#[ { "cat": "Default", "libTraceCatId": 0, "pid": 0, "tid": "Main Thread", "name": "omni::usd::UsdContext::Impl::hydraRender", "ts": 18622411104.959, "ph": "X", "dur": 1094.52 }, { "cat": "Default", "libTraceCatId": 0, "pid": 0, "tid": "Main Thread", "name": "omni::usd::UsdContext::Impl::render (Unlock USD)", "ts": 18622411118.822, "ph": "X", "dur": 5.398 } ]
A Note on the chrome trace format#
The Chrome trace format (See Chrome Trace Spec for a full specification ) is used by many of the profilers discussed here.
The trace files can be opened in a number of native and web-based applications, including the chrome browser itself (type “chrome://tracing” into the address bar).
These files are in JSON format, which is easy to read and parse but not very efficient for large amounts of data. For a reasonably long Kit profiling session, it’s very easy to generate files which are too big to open in most chrome trace readers.
For these cases, we recommend using the import-chrome executable which ships with Tracy to convert them to the more efficient Tracy binary format


