Optimizing Performance#
Overview#
Because Omniverse Kit based apps uses a full range of RTX capabilities there are some key elements to help with getting your project running at its best. There are also optimizations that can benefit specifically one renderer or another. This document is here to shed light on how to keep your project’s performance optimal and how to diagnose quickly when things go awry.
Monitoring Tools#
The two most important elements we will want to generally watch are GPU Usage and GPU Memory however CPU usage and CPU memory are also possible to be overrun. If any of those hit their limits, performance will suffer. To monitor these stats Omniverse USD Composer has a built in profiler and some handy tools based on the operating system you are using. Though not critical it is a very good idea and a best practice to leave these tools open and displaying while you work in Omniverse USD Composer. This way you will see just how much strain any particular action has on your system.
Profiler Extension#
Omniverse has an extension for profiling your project in Omniverse Kit based apps. Featuring a robust look at all related process as well as convenient filters, Omniverse Profiler is a wise place to begin debugging or monitoring your project.
Windows#
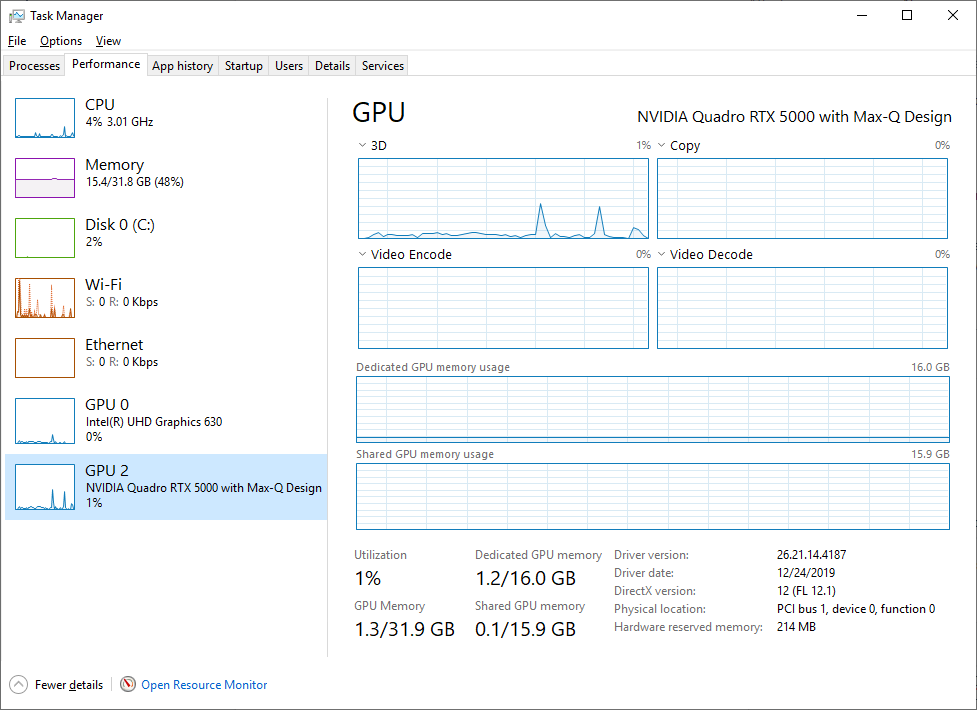
Task Manager is a great resource for giving nice clean graphs and can show peak usage on a variety of system information regarding performance.

Click on the Start icon
Type “Task Manager”
In Task Manager, Select the “Performance” Tab
On the left side of this pane you will see various graphs like CPU, Memory and GPU. Select any of these to get a more detailed view of the data. Generally speaking if any of these are spiking and peaking out, you should look into its cause and begin to troubleshoot.
Linux#
nvidia-smi is a great resource for giving useful data on linux.
See these document for further information.
Getting a Baseline#
It is generally good to get a baseline of your performance before starting up your project. A baseline is simply what your computer is looking like before your project is loaded. In any tool mentioned above take a quick note of your memory and gpu usage with just your working tools running but your project not loaded. These are your baseline measurements. Now when you load a project you can be more accurate on the actual cost of your project as you can subtract the baseline cost of whatever tools you may have running.
Baseline Example#
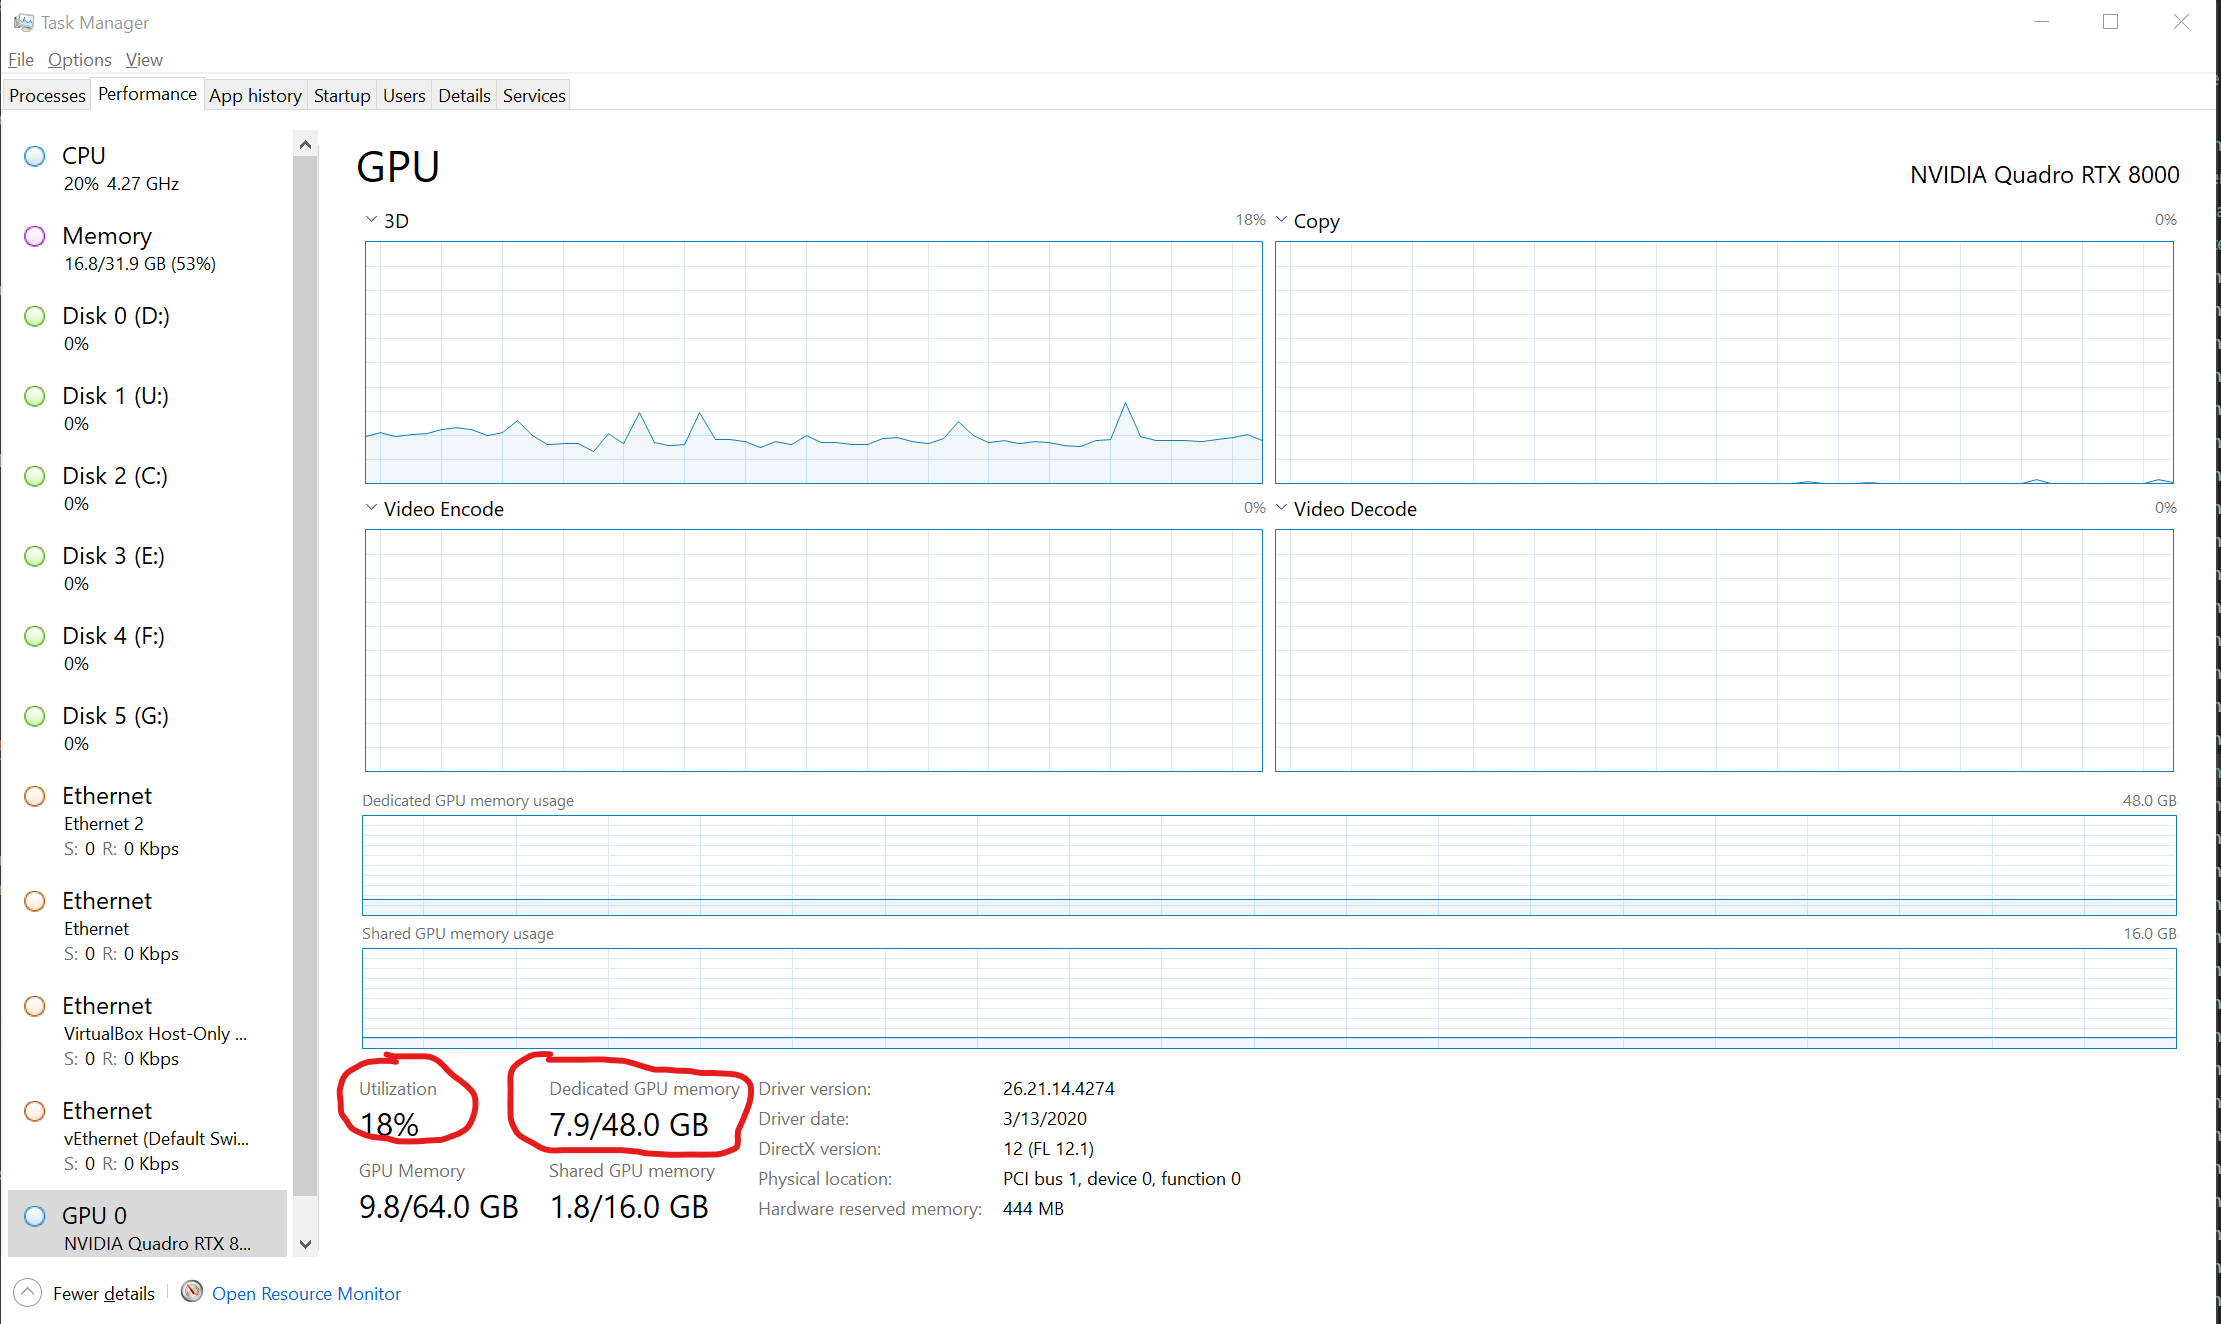
Here we can see an example of a baseline. All tools are running but a project is not yet loaded.

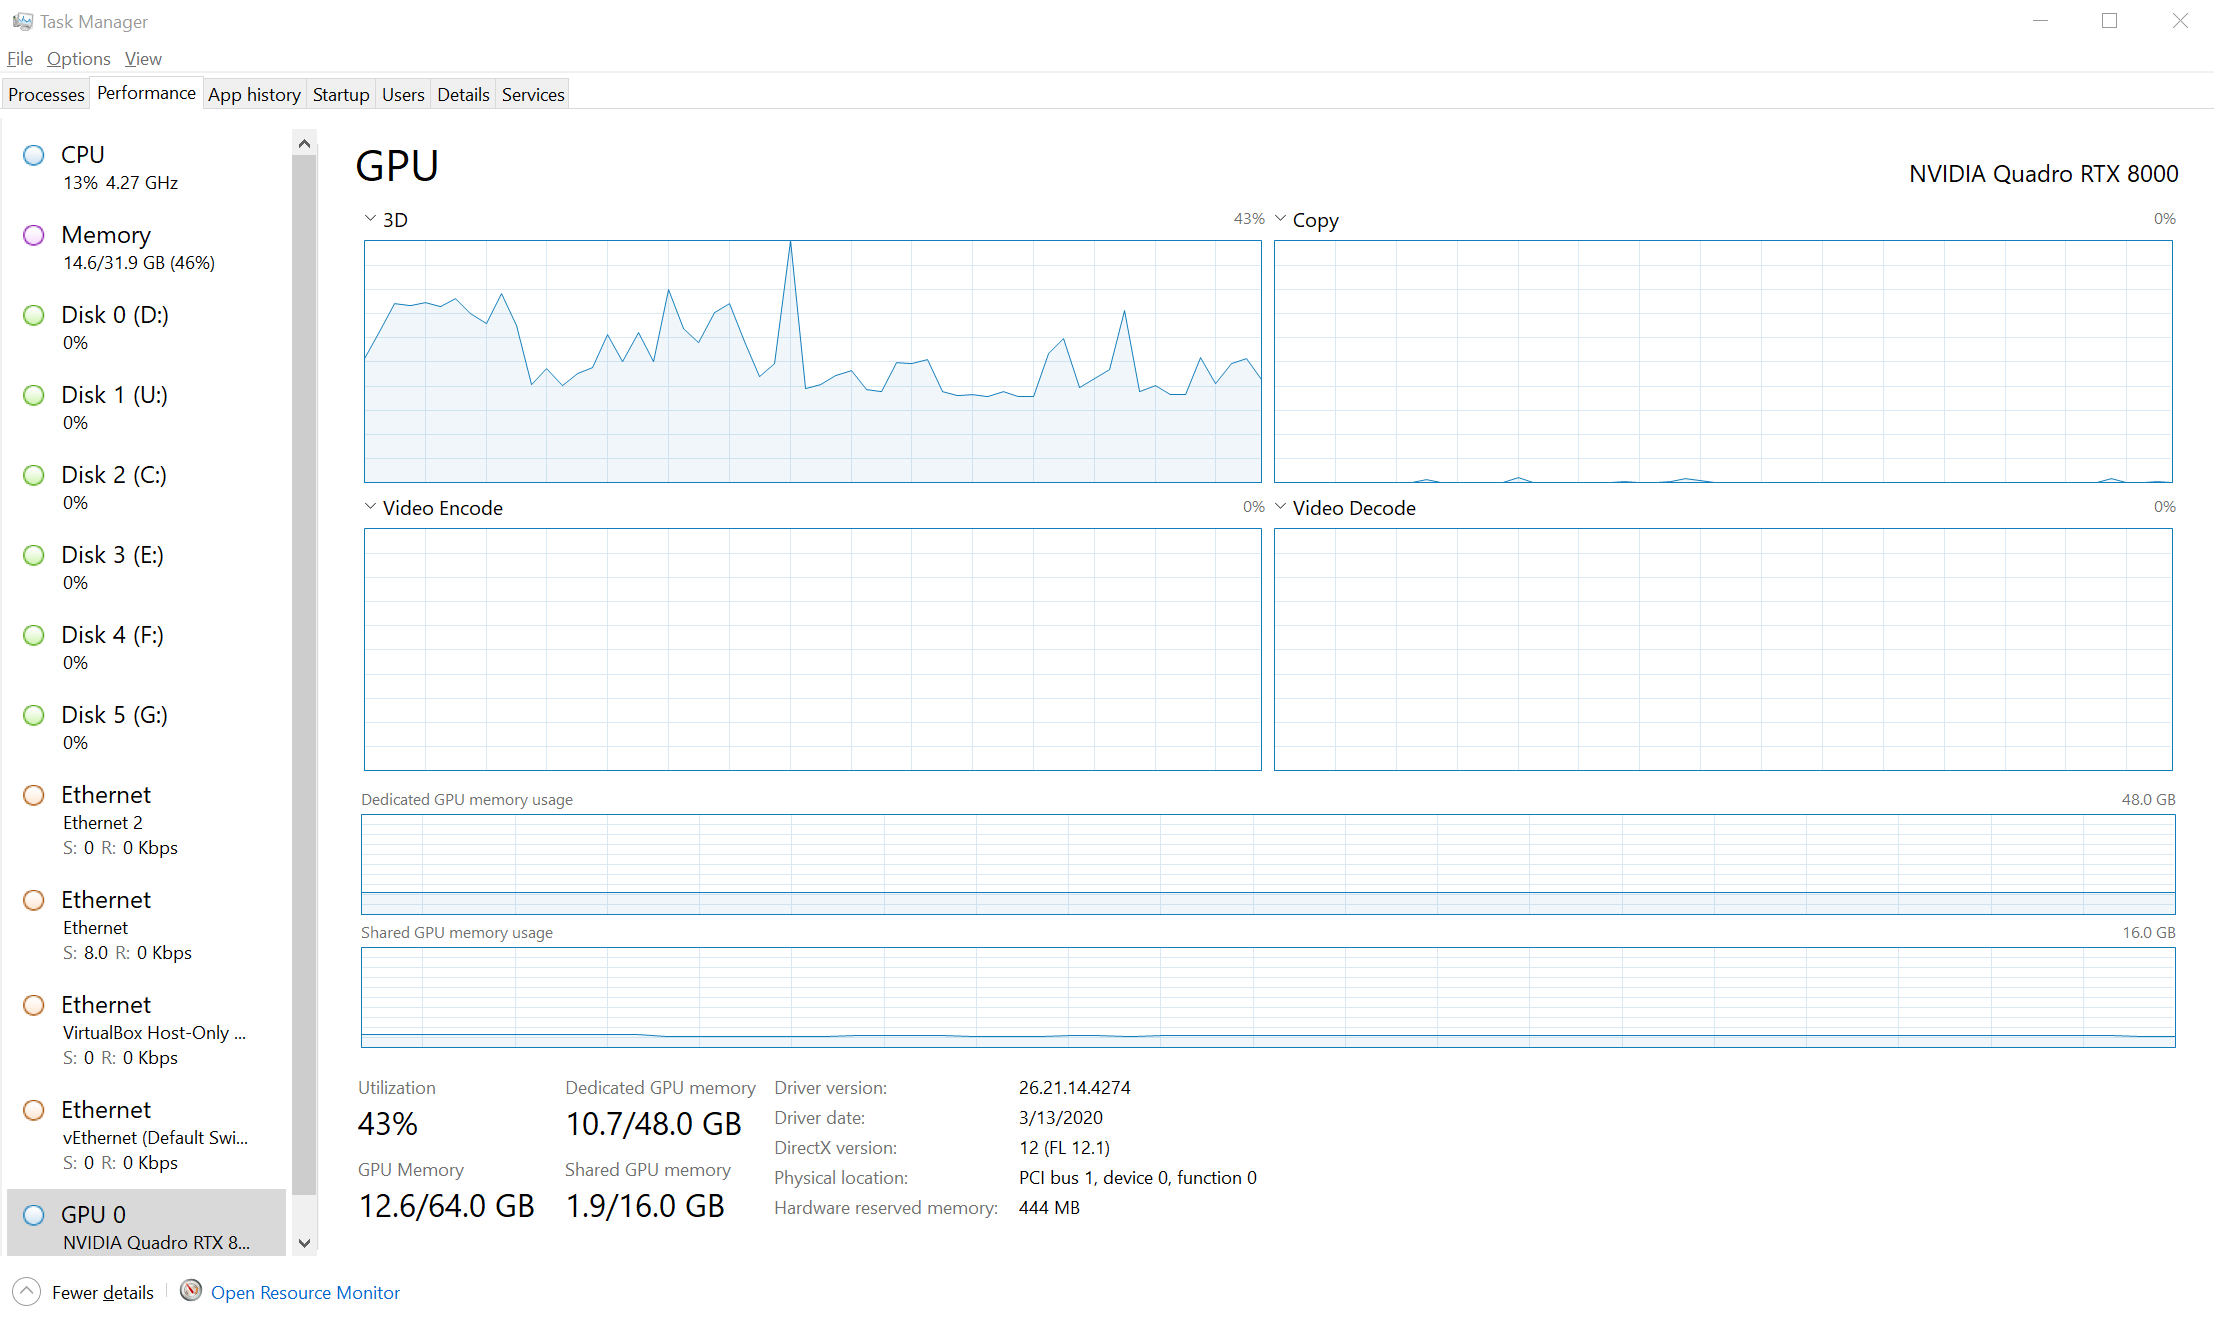
Now we have a large Project Loaded.

To get the actual cost, simply subtract the baseline value from the project loaded value. Calculating from the above example would look like this…
CPU Utilization of Project (project loaded Utilization - baseline utilization = project cost)
43% - 18% = 25%
Dedicated Memory Used by Project (project loaded Mem Gb - baseline Mem Gb = project cost)
10.7Gb - 7.9Gb = 2.8Gb
Note
This information can be useful to know if you are working on a target platform where memory/GPU power is lower than the development system.