Case #4: Using Cosmos for Synthetic Dataset Augmentation#
Scenario#
When developing a synthetic dataset, development traditionally takes a lot of visual expertise and time to create. Cosmos Transfer1 makes it possible to create massive amounts of variations via prompts and close the appearance domain gap, effortlessly creating photorealistic results from a much smaller synthetic ground truth dataset. In this example, we will develop a basic workflow for modifying an existing synthetic dataset using Cosmos Transfer1.
Preparing a Synthetic Dataset with Omniverse Isaac Sim and Replicator#
Isaac Sim enables developers to develop, simulate, and test AI-driven robots in physically-based virtual environments. In this example we use Replicator within Isaac Sim to generate ground truth Synthetic Data. This is then used as inputs for Cosmos Transfer1 to guide the outputs.
Prerequisites#
Familiarity with USD / Isaac Sim APIs for scene creation and manipulation.
Familiarity with omni.replicator and its writers.
Running simulations as Standalone Applications or via the Script Editor.
Scenario Setup#
The following scene uses the warehouse environment from the Isaac Sim Documentation.
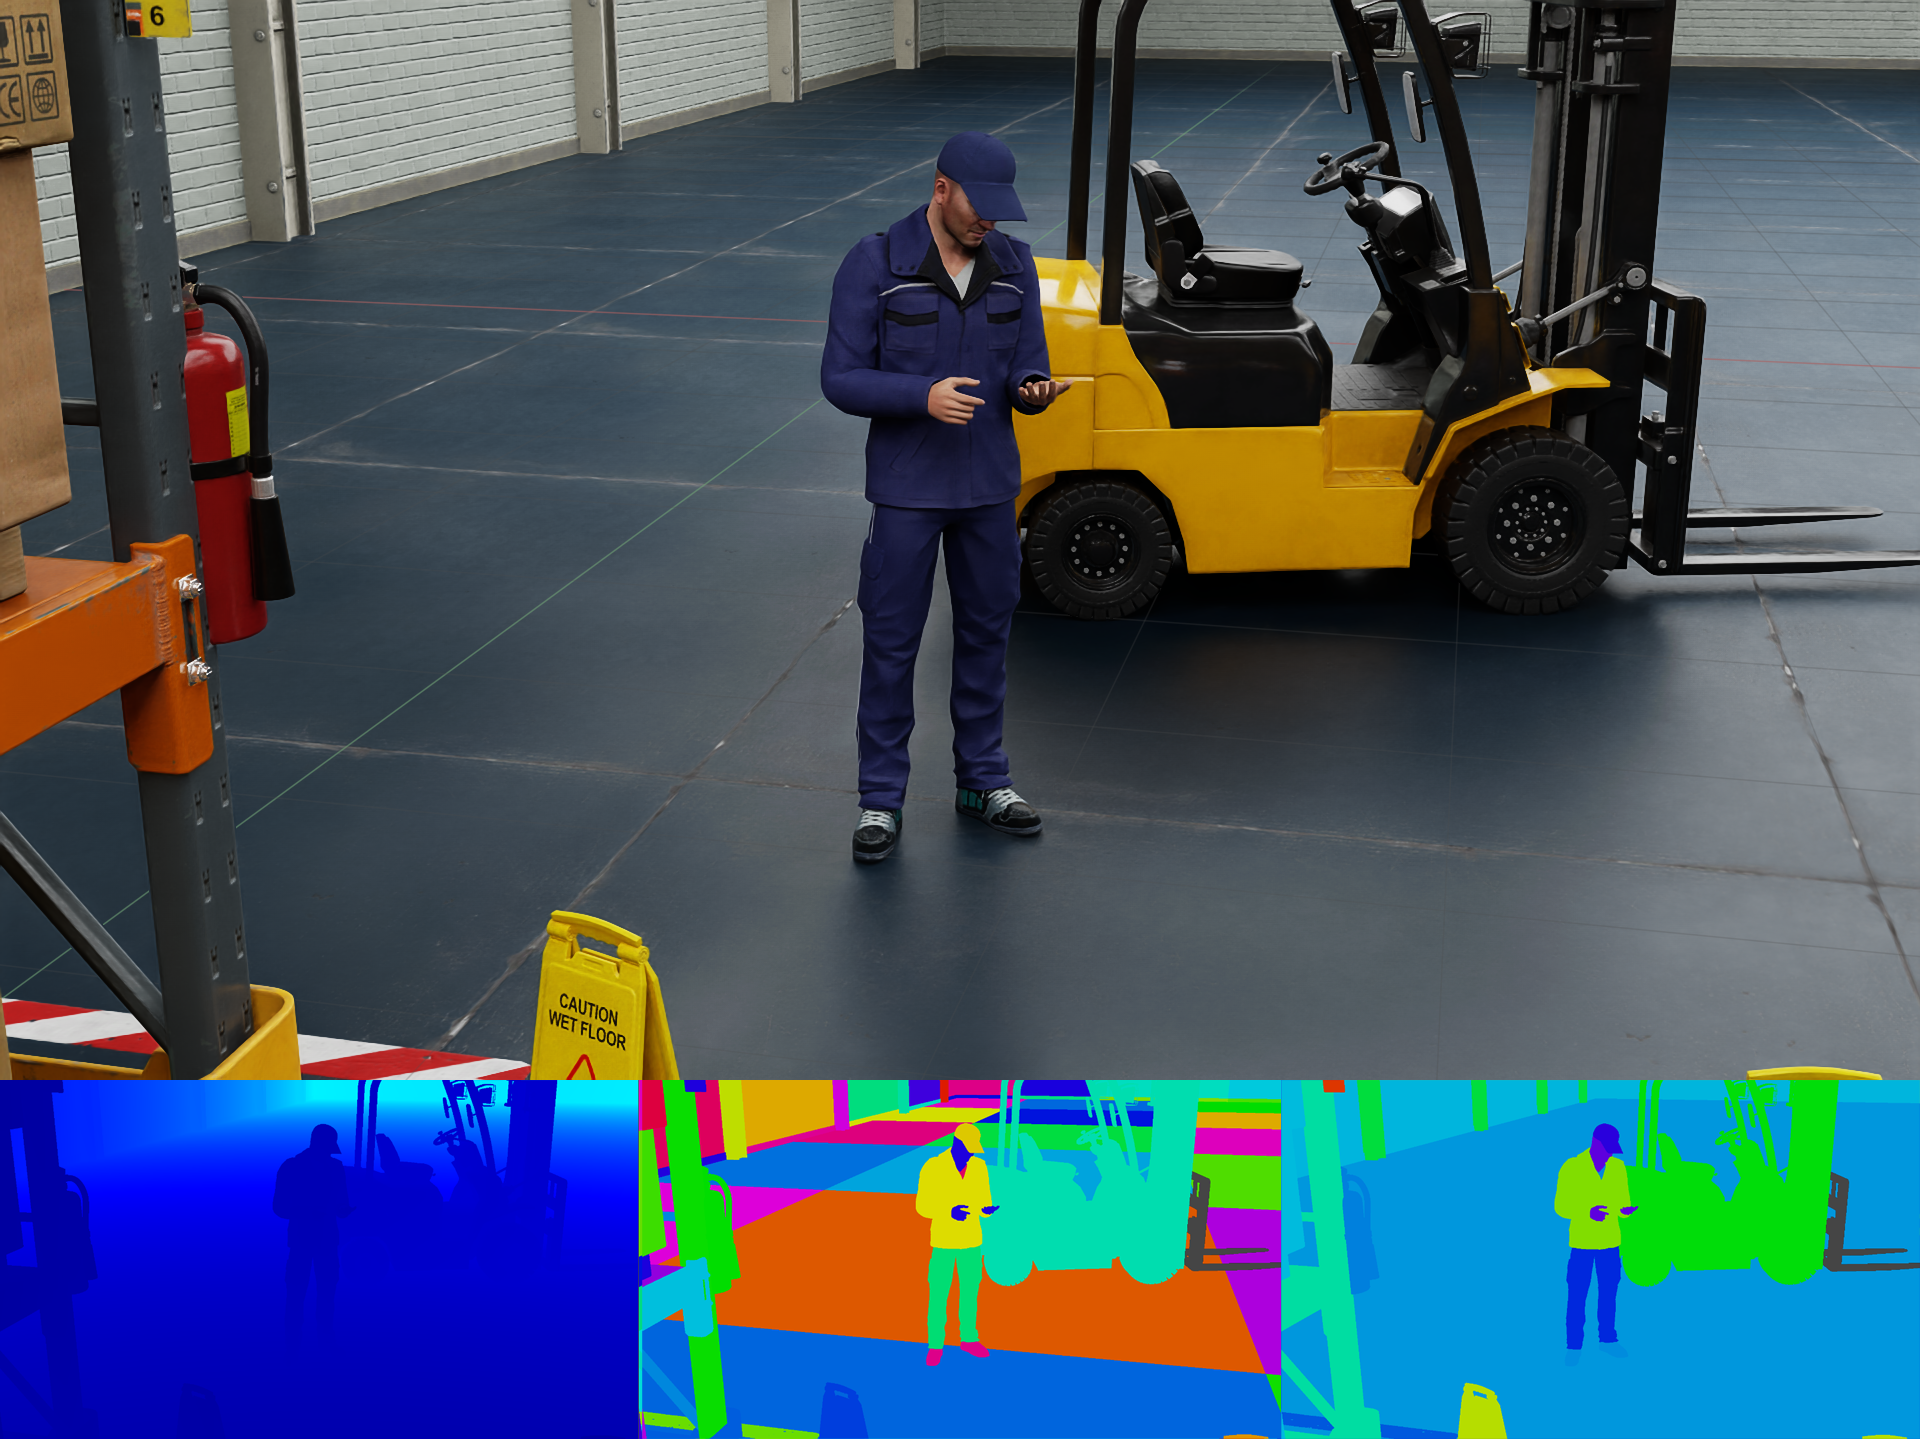
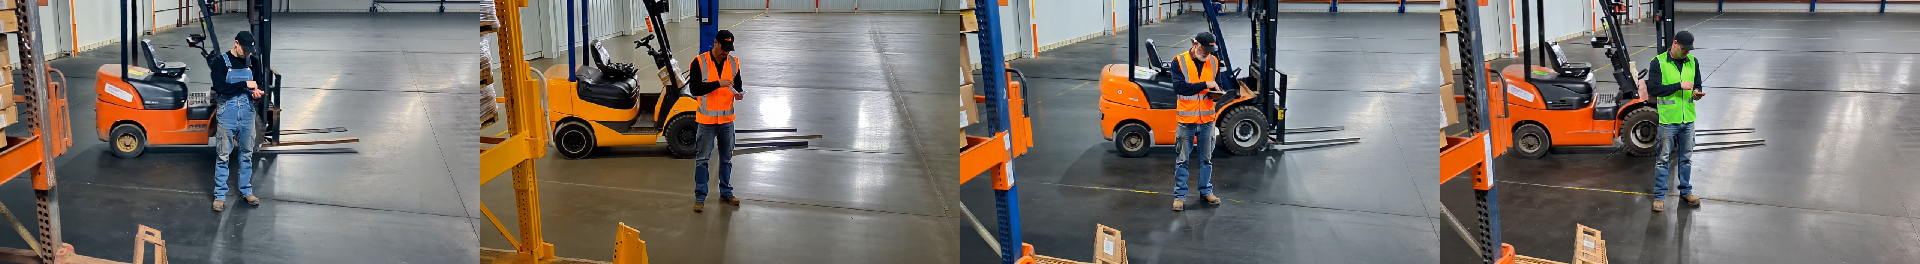
The scene has a distant camera with a person, a moving forklift and a sparse background for the purposes of demonstrating various possibilities with Cosmos Transfer1.
Download and Install. Isaac Sim 4.5 or higher. We recommend the
Workstation Installation, as this example uses the Editor.Launch
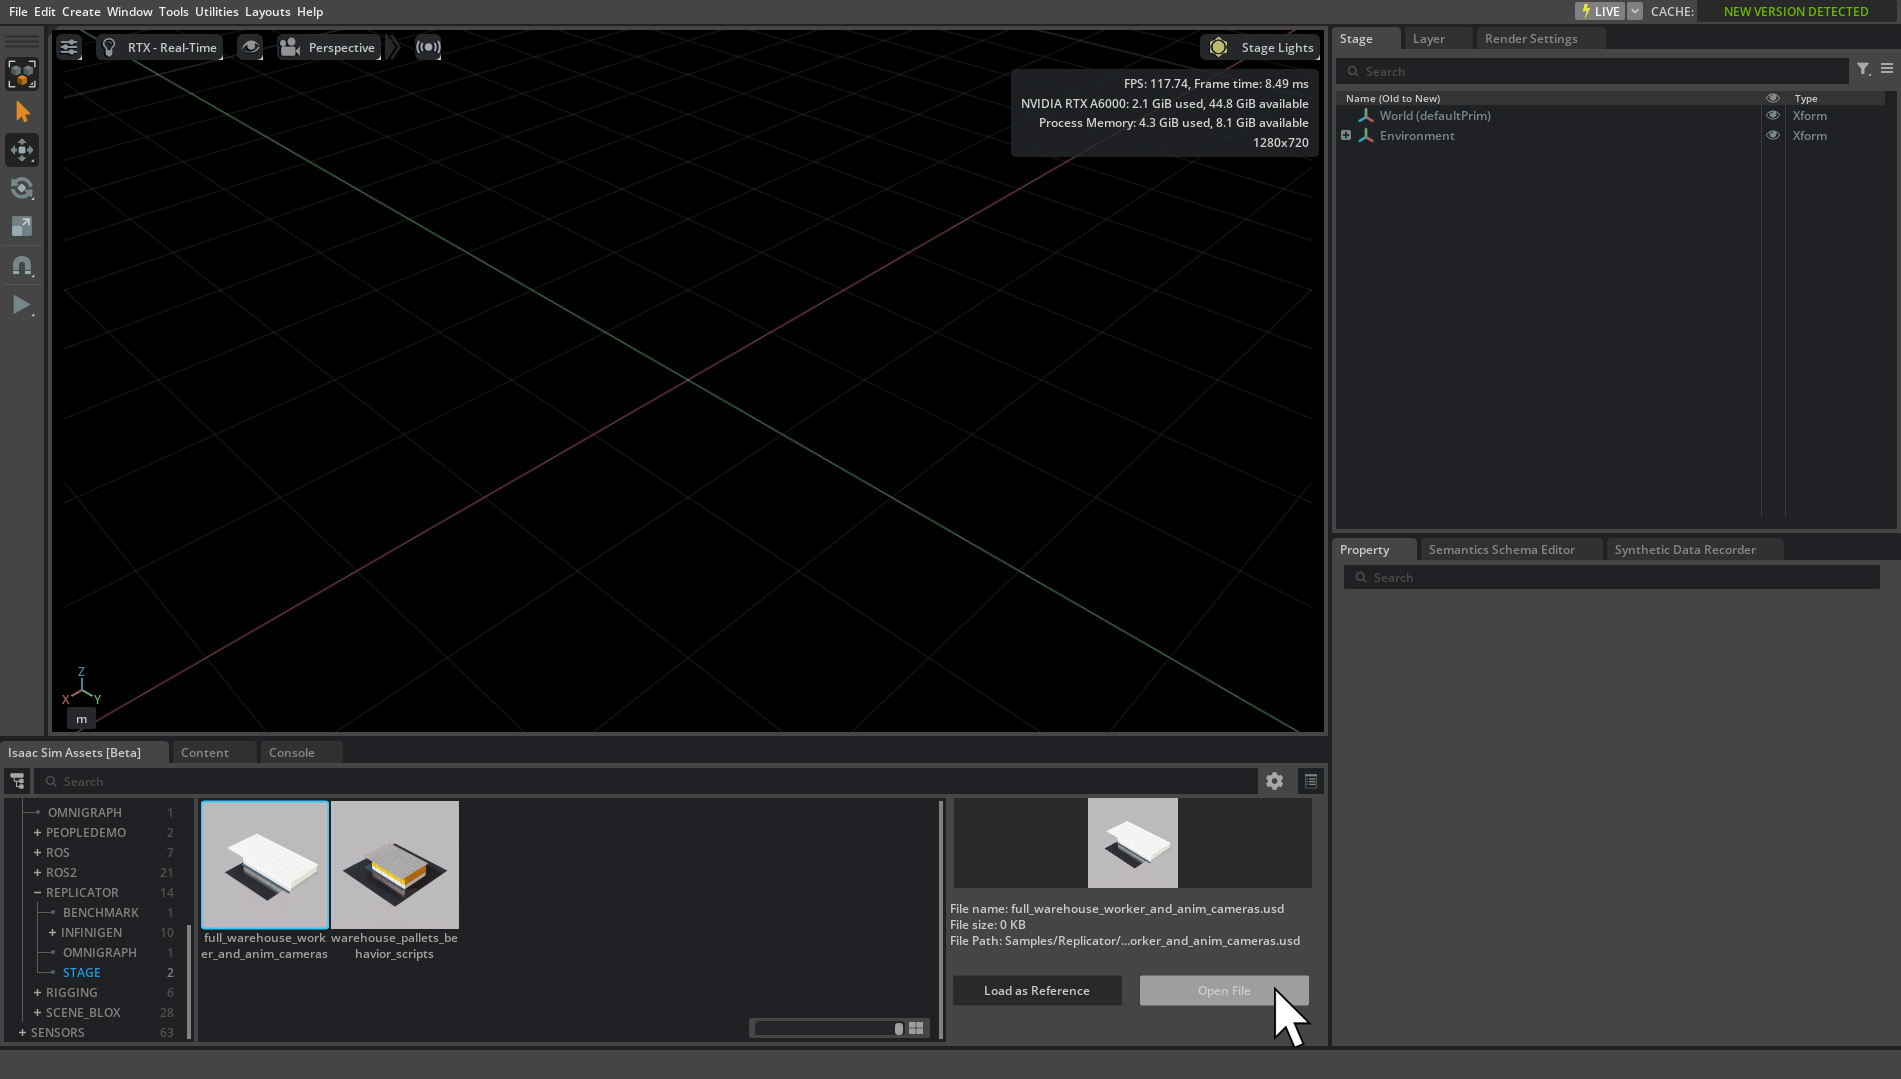
Isaac Simthrough the App Selector.The stage asset used is the same found in the
Getting Startedsection of the Isaac Sim Documentation.Browse under SAMPLES > REPLICATOR > STAGE > full_warehouse_worker_and_anim_cameras.usd, or it can be loaded using the Content Browser by inserting the whole URL in the path field.
Note
The scene may initially take some time to open, downloading assets as needed and compiling shaders.
Implementation with Replicator Cosmos Writer#
We introduce a new Replicator Writer CosmosWriter. CosmosWriter generates AOVs such as canny, depth and segmentation as videos ready to be used as inputs for Transfer1.
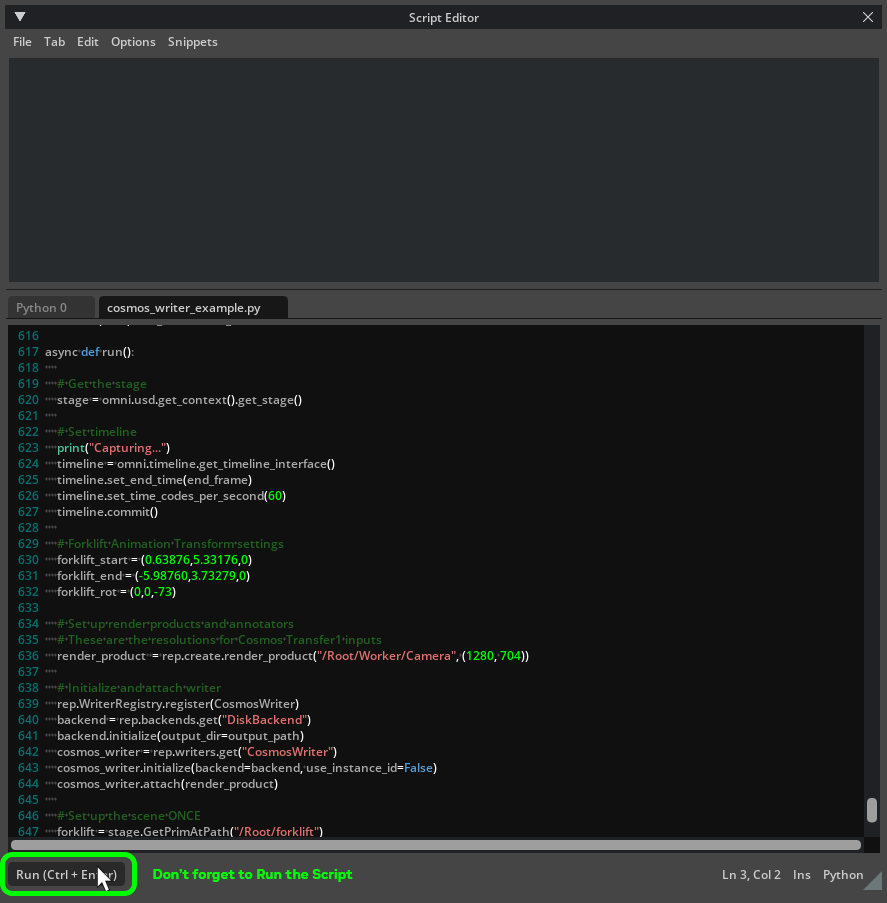
Open the cosmos_writer_example.py script file and set the variable
output_pathto a local directory, then save.With the scene open, run the script in the Script Editor, either opening the script file through the File > Open menu, or by pasting the script text into the open tab within the Script Editor.
Don’t forget to press the Run button at the bottom of the Script Editor to execute the script and start generating the Synthetic Data output videos.
Note
CosmosWriterwill be included in Isaac Sim 5.0 natively, so please use the Isaac Sim 5.0 script.
Once run, the writer outputs will be generated under the output_path as frames and .mp4 videos ready to be used with Cosmos Transfer1.
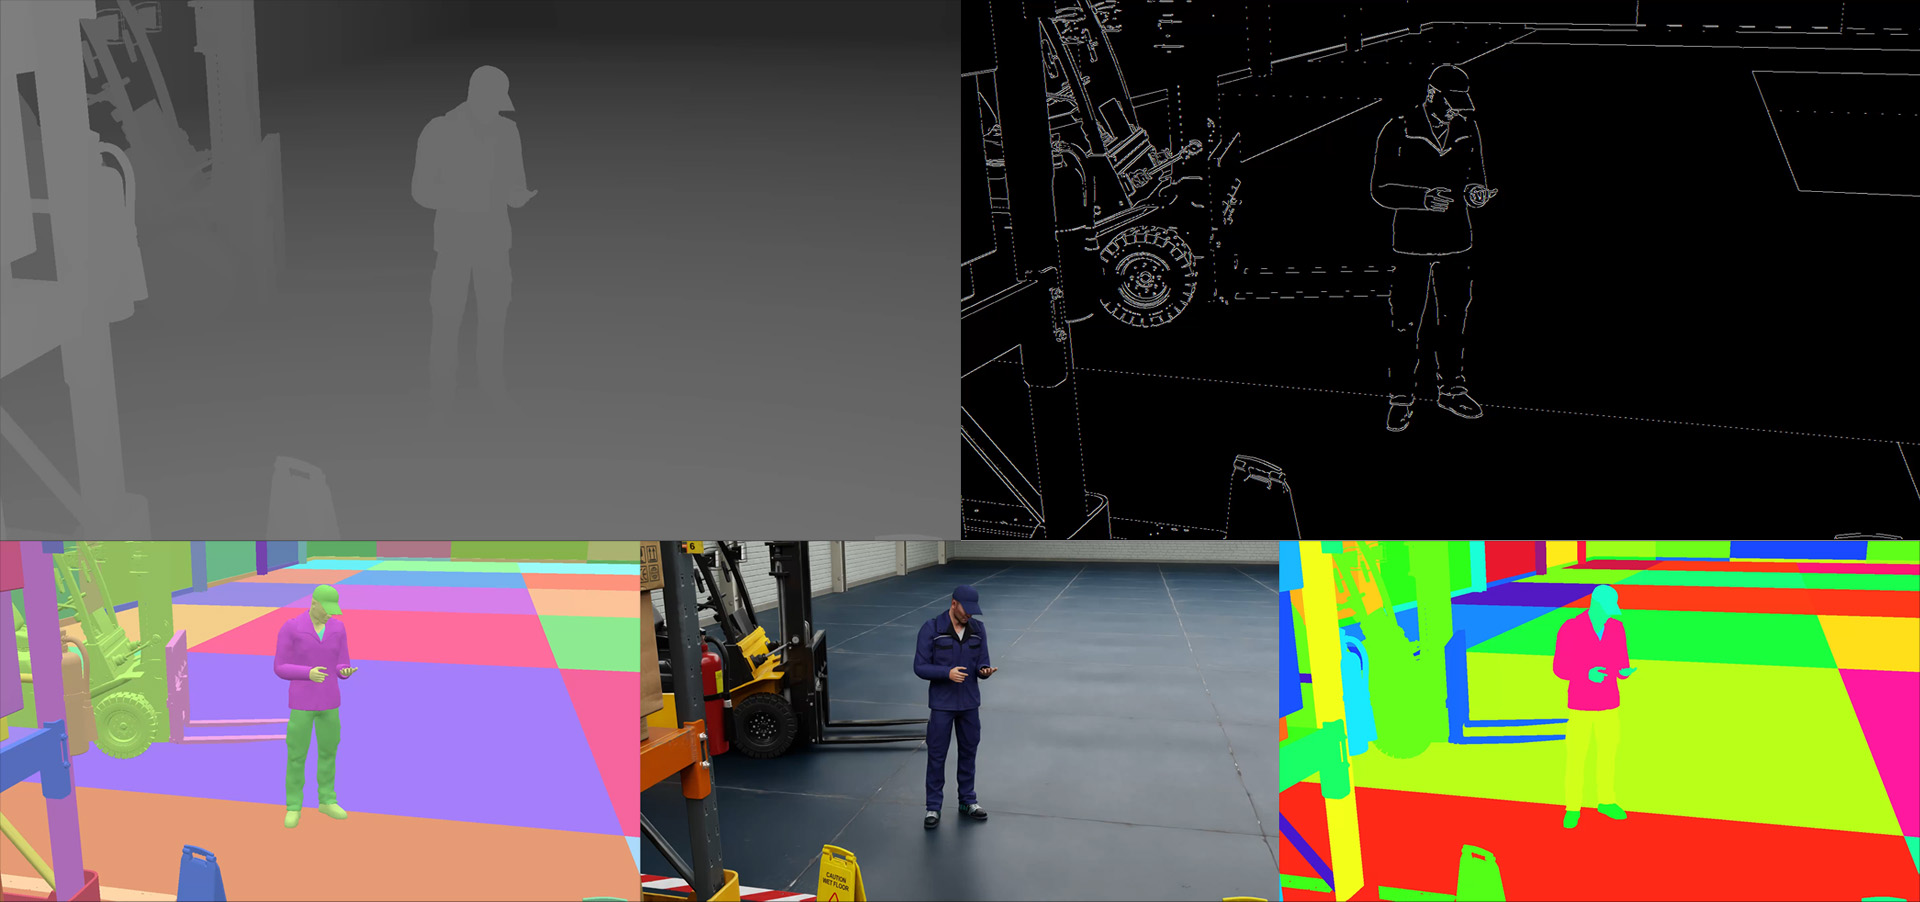
CosmosWriter outputs frames and video for the following modalities:
Modality |
Description |
|---|---|
Greyscale 8bit based on distance to camera. |
|
Canny Edges built from shaded segmentation. |
|
Colored segmentation based on unique meshes. |
|
Images with texture and lighting. |
|
Instance Segmentation combined with a shaded value based on a light direction and scene normals. |
Results#
Your outputs of Cosmos Writer should be similar to the images below. For convenience we provide the pre-generated videos of the example scene here .
CG to Real with Cosmos Transfer1#
Overview#
Cosmos Transfer-1 broadly provides two types of augmentation for Synthetic Data.
Generating photorealistic scenes from ground truth.
Creating diversity of scenes, effectively domain randomizing details while retaining the structure.
Prerequisites#
Cosmos Transfer1 is available on GitHub and Huggingface. Comprehensive documentation covering the installation, setup and inference of Transfer1 and the other Cosmos WFMs is here.
The Transfer Model Reference page is especially useful, with clear examples and full parameter descriptions.
Multimodal Control#
Multimodal Control allows “Maximum Controllability with Minimum Effort” so that developers can effortlessly make the jump from any level of fidelity or sensor modality (including CG ground truth simulations, object level representations, to real captured fleet footage) to photorealism in their SDG.
The combination of segmentation, canny and depth give a high degree of adherence to the input ground truth, yet generated photorealistic variations of the scene based on the prompt.
General Parameters and Best Practices for SDG#
Using the sample commands on GitHub, you can test different prompts and parameters to achieve very different visual results.
To get you started, try using the following prompt and parameters:
A well-lit warehouse with high ceilings and bright overhead fluorescent lights.
The clean yet slightly worn concrete floor reflects the ambient lighting.
A worker stands in an orange safety vest, jeans and a black baseball cap.
A yellow and black forklift moves forward smoothly and purposefully.
Painted metal storage racks line the background, filled with varied
boxes, packages, and additional palettes. Against the far walls are
palettes and packages wrapped in plastic. The warehouse appears
organized and operational, evoking a sense of efficiency and industrial precision.
Some things to consider:
Provide rich and descriptive prompts. These prompts can positively impact the output quality of the model.
Describe a single, captivating scene: Focus on a single scene to prevent the model from generating videos with unnecessary shot changes.
Limit camera control instructions: The model does not handle prompts involving camera control well, as this feature is still under development.
Prompt upsampler limitations: The current version of the prompt upsampler may sometimes deviate from the original intent of your prompt, adding unwanted details. If this happens, you can disable the upsampler with the
--disable_prompt_upsamplerflag and edit your prompt manually.We recommend using prompts of around 120 words for optimal quality.
An example of a bad prompt is a short sentence like this.
A warehouse with a person and a forklift.
The
sigma_maxparameter determines the amount of corruption by noise (forward diffusion).The larger the amount, the more noise is added prior to the de-noising by the model.
Lower sigmas result in more tightly matching the input video. For SDG, try for a high
sigma_maxvalue of 80. At 80, the colors from the input videos will be completely diffused, allowing the prompt to have greater control.
When using Multimodal Control the combined
control_weightof all modalities, such asedgeanddepth,should not exceed2.0.Various aspect ratios are supported, including
1:1(960x960 for height and width),4:3(960x704),3:4(704x960),16:9(1280x704), and9:16(704x1280). The frame rate is also adjustable within a range of 12 to 40 fps.The current version of the model only supports
121frames.guidancecontrols the strength of the adherence to the prompt. A guidance of 5 to 7 will closely follow the prompt. Lower values will be more creative and have more variation.All full list of parameters can be found in the Arguments section of the Transfer1 Reference.
Results#
Shown below is an example augmentation from the sample video with Cosmos Transfer1.
An endless amount of variety can be achieved by changing the prompts and parameters.
Combining synthetic ground truth from Omniverse and Cosmos WFMs brings a new level of realism, speed and variety to Synthetic Data Generation.
Real to Real with Cosmos Transfer1#
Transfer-1 can also take real world video creating realistic variations with a prompt. This forms the basis of a video to video domain randomization SDG workflow.
Each prompt creates variations for each output video. When prompts are generated with an LLM, an automated pipeline can produce a large amount of realistic outputs rapidly.
The above example uses this prompt, to convert a dashcam view in winter, to summer.
--control_weight=0.3--guidance=5.0--sigma_max=80
The scene is a sunny summer day with green grass and deep blue skies.
The camera remains fixed, mounted on the dashboard, as the vehicle continues smoothly down the highway.
The black SUV ahead maintains its lane but gradually inches forward, slowly pulling away.
The overpass draws nearer until it briefly fills the upper part of the frame, then passes overhead.
The scene remains tranquil, with no sudden movements, just the quiet, forward motion of a summer drive.
Scene Extrapolation with Cosmos Predict2#
Overview#
Cosmos Predict-2 can accelerate synthetic data generation (SDG) by generating a video from text, or extrapolating a scene with text + image/video. These videos can then be processed through a segmentation model like Segment Anything Model ( SAM2) to recapture the masks of important object classes.
Real world or generated video and images used as input can offer flexibility and speed when data is scarce.
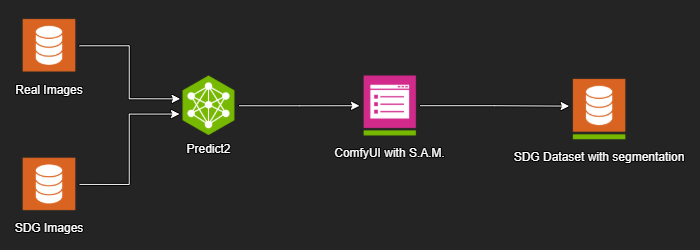
Tools such as ComfyUI enable developers to build advanced workflows that can generate and or process videos for segmentation and more. Below is a simple comfyUI workflow to demonstrate segmentation from a video.
Prerequisites#
Cosmos Predict2 installation, setup and inference can be found in the Quickstart Guide. The Model Reference contains Sample Commands, Prompt Guidelines and Parameter definitions.
The workflow for ComfyUI requires download and installation with basic understanding of the application.
Setup#
Download and install the ComfyUI app.
Open the ComfyUI app, and open the provided example graph through the menu Workflow > Open .
A popup window will alert you to missing custom nodes that can now be installed.
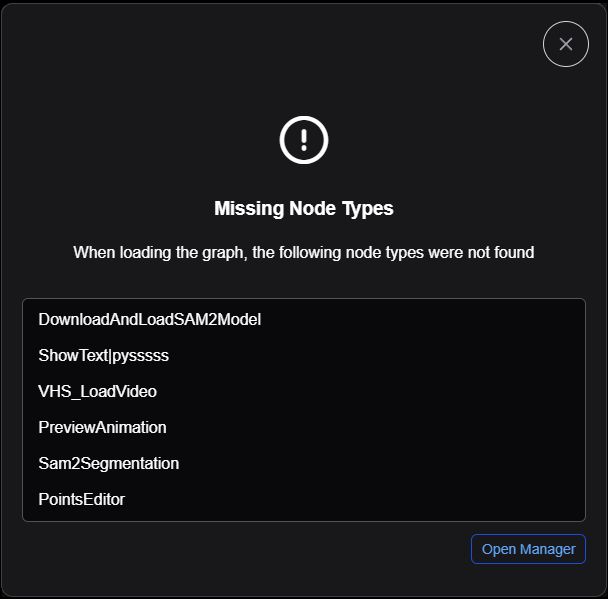
Click the
Open Managerbutton.Click the
Installbutton on each of the presentedNode Packs.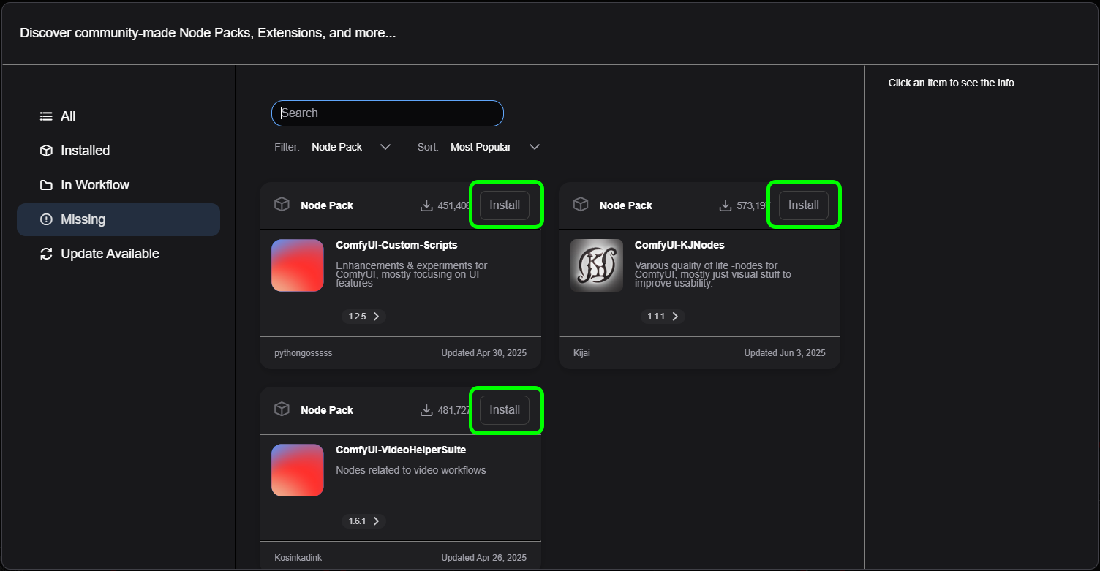
Next, download the SAM models on Huggingface for ComfyUI.
Place the downloaded files into your ComfyUI installation under
ComfyUI\models\sam2.
Restart your ComfyUI app.
Reopen the
sam_segmentation.jsongraph, and ensure there are no red bordered nodes.If there are, open the
Managerbutton in the top right corner of the app, andInstall Missing Custom Nodes. See which nodes remain missing and install them, and restart comfyUI.
On the
Load Videonode at the far left, clickchoose video to uploadand select the provided example, or a different video as desired.If needed reposition the green circles in the
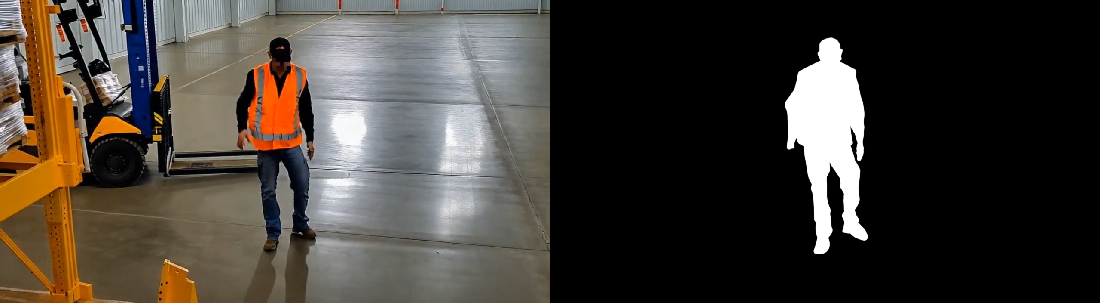
Points Editornode in the middle of the graph. Locate them over the person in the video, chest and legs.Runthe graph to process the video and segment the person using the SAM2 model.
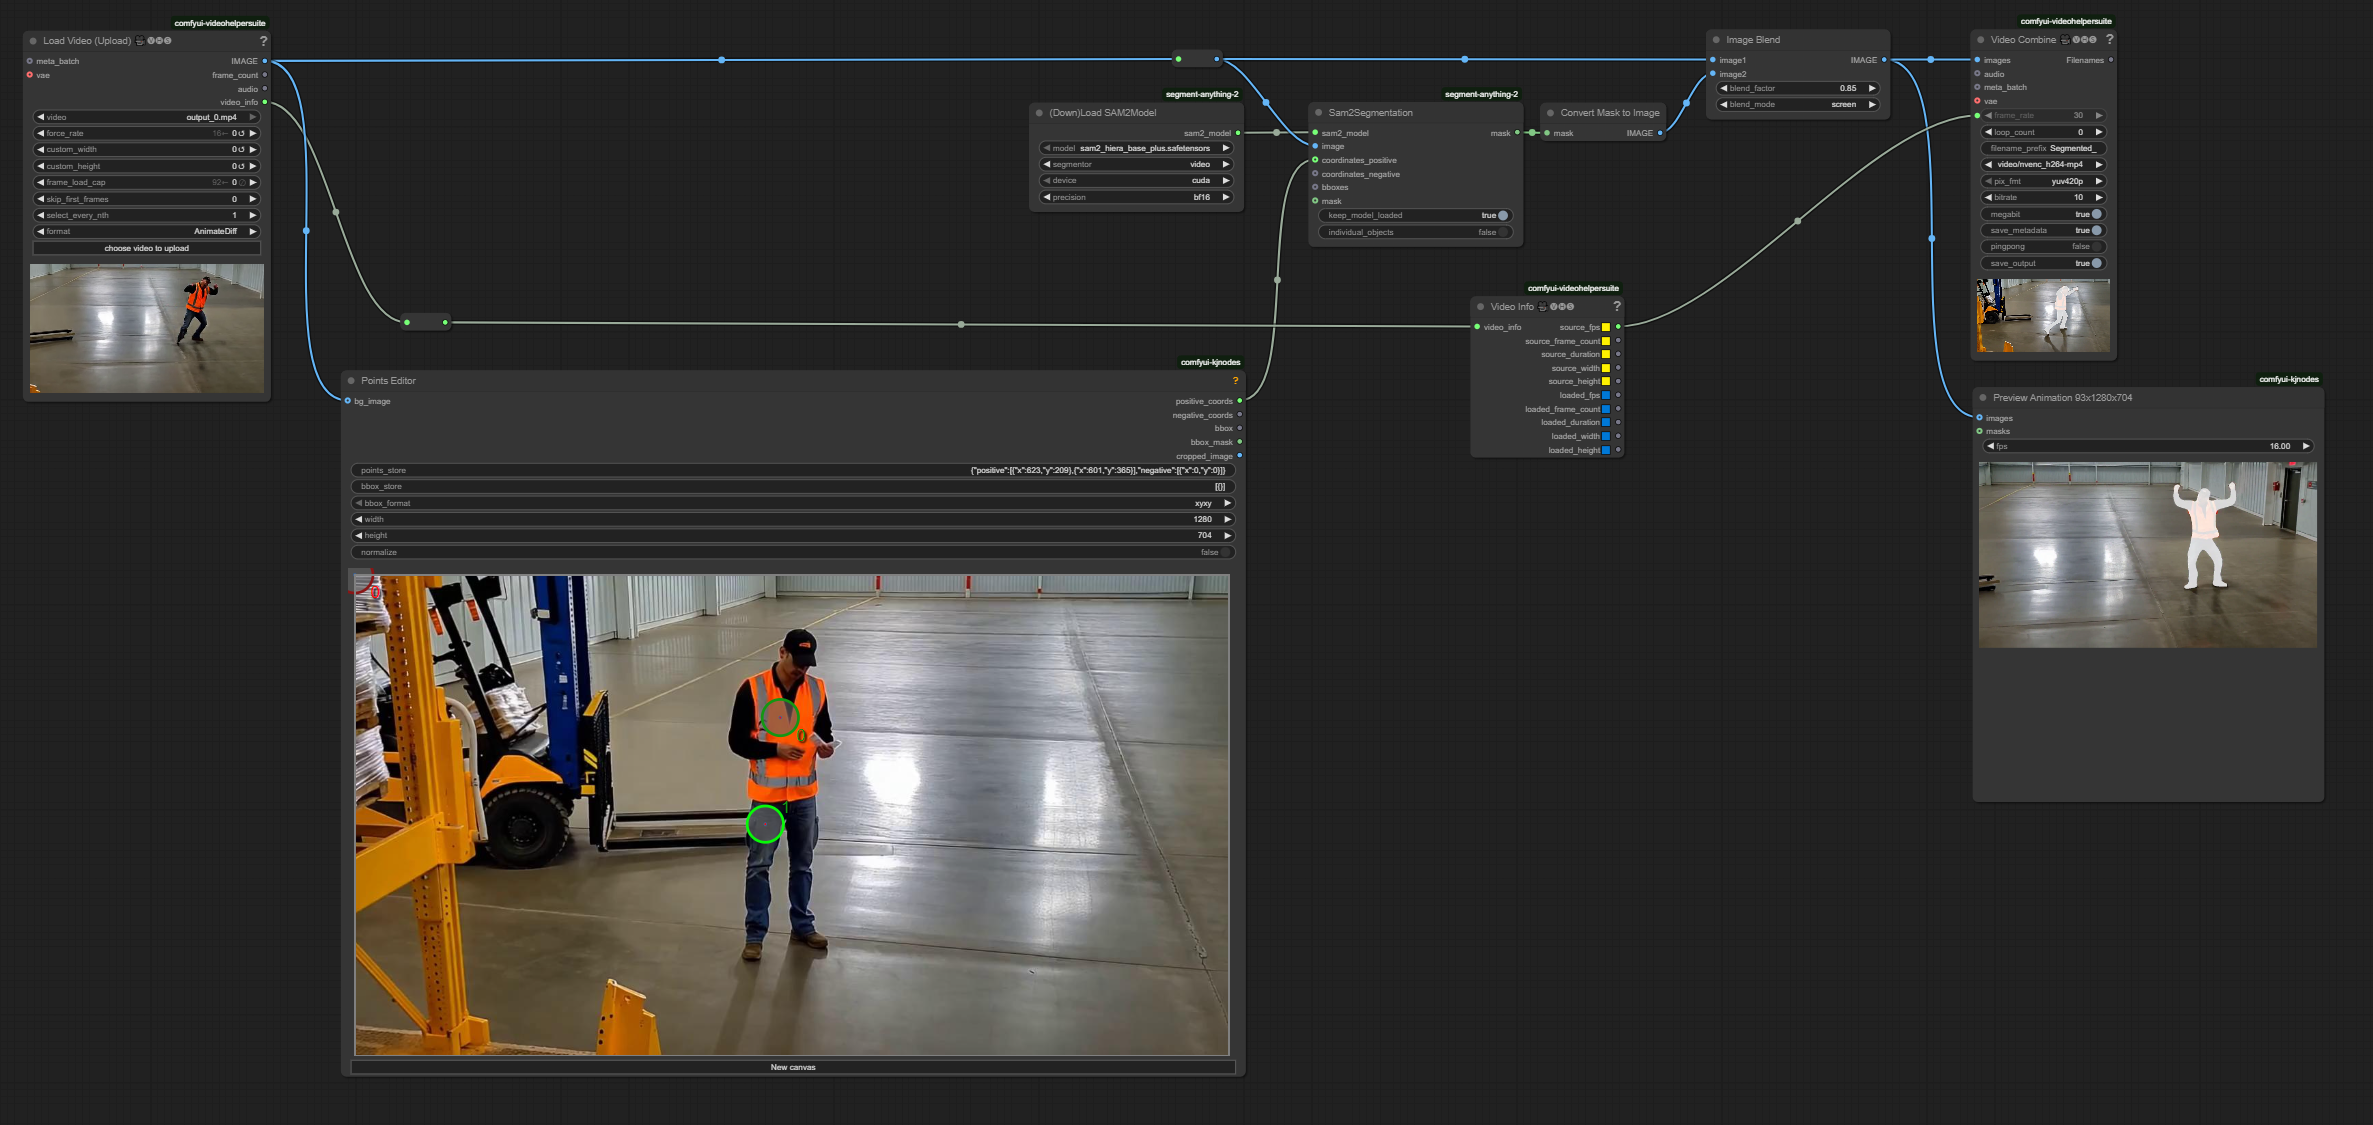
The final output will look like this as a visualization for the segmentation extraction. ComfyUI will output saved images and videos to ComfyUI\output.
Post Process Visualizations#
We recommend overlaying the Synthetic Data visualizations to evaluate accuracy and debug issues. Tweaking the parameters of generations for various types of content is an important part of getting the best results. Having a visualization helps greatly to spot issues and inconsistencies.